Hystrix 断路器
Hystrix 断路器
为什么需要断路器?
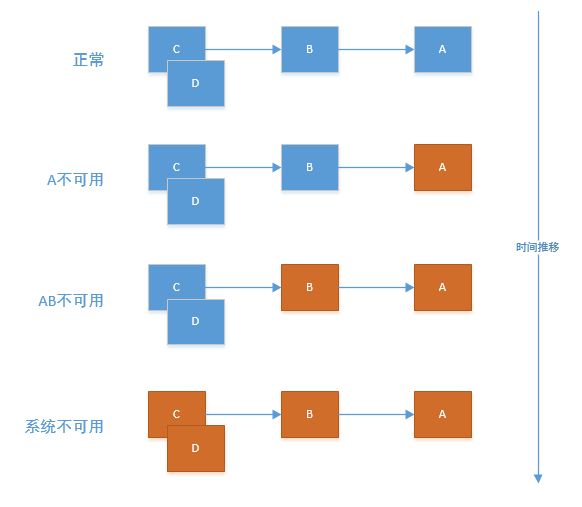
A作为服务提供者,B为A的服务消费者,C和D是B的服务消费者。A不可用引起了B的不可用,并将不可用像滚雪球一样放大到C和D时,雪崩效应就形成了。
因此,需要实现一种机制,可以做到自动监控服务状态并根据调用情况进行自动处理。
- 记录时间周期内服务调用失败次数
- 维护断路器的打开、关闭、半开三种状态
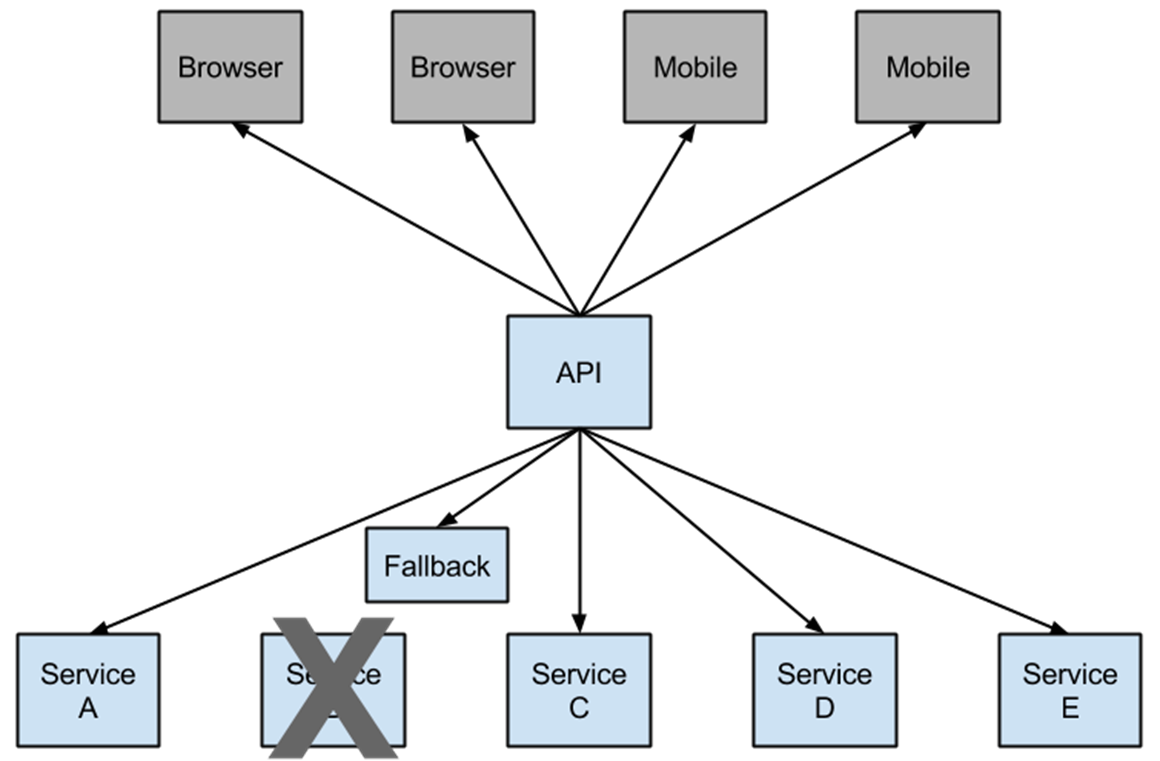
- 提供fallback机制
修改bill-service项目:
pom.xml
        <dependency>
            <groupId>org.springframework.cloud</groupId>
            <artifactId>spring-cloud-starter-netflix-hystrix</artifactId>
        </dependency>
application.xml
feign:
  hystrix:
    enabled: true
启动类添加注解@EnableCircuitBreaker
package com.luffy.billservice;

import org.springframework.boot.SpringApplication;
import org.springframework.boot.autoconfigure.SpringBootApplication;
import org.springframework.cloud.client.circuitbreaker.EnableCircuitBreaker;
import org.springframework.cloud.client.discovery.EnableDiscoveryClient;
import org.springframework.cloud.openfeign.EnableFeignClients;

@SpringBootApplication
@EnableDiscoveryClient
@EnableFeignClients
@EnableCircuitBreaker
public class BillServiceApplication {

    public static void main(String[] args) {
        SpringApplication.run(BillServiceApplication.class, args);
    }

}
UserServiceCli.java
package com.luffy.bill.interfaces;

import com.luffy.bill.entity.User;
import org.springframework.cloud.openfeign.FeignClient;
import org.springframework.web.bind.annotation.GetMapping;
import org.springframework.web.bind.annotation.PathVariable;

@FeignClient(name="user-service", fallback = UserServiceFallbackImpl.class)
public interface UserServiceCli {

    @GetMapping("/user")
    public String getUserService();

    @GetMapping("/user/{id}")
    public User getUserInfo(@PathVariable("id") int id);
}
UserServiceFallbackImpl.java
package com.luffy.billservice.interfaces;

import com.luffy.billservice.entity.User;
import org.springframework.stereotype.Component;

@Component("fallback")
public class UserServiceFallbackImpl implements UserServiceCli{

    @Override
    public String getUserService() {
        return "fallback user service";
    }

    @Override
    public User getUserInfo(int id) {
        User user = new User();
        user.setId(1);
        user.setName("feign-fallback");
        return user;
    }
}
停止user-service测试熔断及fallback。
当注册中心后面维护的服务实例出现故障后,注册中心会存在时间差来感知到服务故障,这个时间差主要通过如下方面来调节:
-
eureka server检测实��例是否过期的周期时间
-
eureka server端
server:
  port: ${EUREKA_PORT:8761}
eureka:
  client:
    service-url:
      defaultZone: ${EUREKA_SERVER:http://${spring.security.user.name}:${spring.security.user.password}@localhost:8761/eureka/}
    fetch-registry: true
    register-with-eureka: true
  instance:
    instance-id: ${eureka.instance.hostname}:${server.port}
    hostname: ${EUREKA_INSTANCE_HOSTNAME:localhost}
    prefer-ip-address: true
  server:
    # 间隔5秒执行一次检测任务
    eviction-interval-timer-in-ms: 5000
spring:
  security:
    user:
      name: ${EUREKA_USER:admin}
      password: ${EUREKA_PASS:admin}
  application:
    name: eureka-cluster
-
-
eureka client注册端设置的心跳超时后剔除该实例的时间
-
针对user-service
server:
  port: 7000
eureka:
  client:
    serviceUrl:
      defaultZone: ${EUREKA_SERVER:http://admin:admin@localhost:8761/eureka/}
  instance:
    instance-id: ${eureka.instance.hostname}:${server.port}
    prefer-ip-address: true
    hostname: ${INSTANCE_HOSTNAME:user-service}
    #eureka客户端需要多长时间发送心跳给eureka服务器,表明他仍然或者,默认30秒
    lease-renewal-interval-in-seconds: 2
    #eureka服务器在接受到实例的最后一次发出的心跳后,需要等待多久才可以将此实例删除
    lease-expiration-duration-in-seconds: 2
spring:
  application:
    name: user-service
-
-
eureka client 调用端的同步eureka注册表的时间周期
比如针对bill-service
server:
  port: 7001
eureka:
  client:
    serviceUrl:
      defaultZone: ${EUREKA_SERVER:http://admin:admin@localhost:8761/eureka/}
    registry-fetch-interval-seconds: 5
  instance:
    instance-id: ${eureka.instance.hostname}:${server.port}
    prefer-ip-address: true
    hostname: ${INSTANCE_HOSTNAME:bill-service}
spring:
  application:
    name: bill-service
user-service:
  ribbon:
    NFLoadBalancerRuleClassName: com.netflix.loadbalancer.RandomRule
feign:
  hystrix:
    enabled: true
Hystrix Dashboard
前面一章,我们讲解了如何整合Hystrix。而在实际情况下,使用了Hystrix的同时,还会对其进行实时的数据监控,反馈各类指标数据。今天我们就将讲解下Hystrix Dashboard和Turbine.其中Hystrix Dashboard是一款针对Hystrix进行实时监控的工具,通过Hystrix Dashboard我们可以在直观地看到各Hystrix Command的请求响应时间, 请求成功率等数据,监控单个实例内的指标情况。后者Turbine,能够将多个实例指标数据进行聚合的工具。
在eureka注册中心处访问bill-service的服务actuator地址: http://192.168.136.1:7001/actuator/info
若访问不了,需要添加如下内容:
-
为服务消费者bill-service的pom.xml添加依赖:
        <dependency>
            <groupId>org.springframework.boot</groupId>
            <artifactId>spring-boot-starter-actuator</artifactId>
</dependency> -
修改application.yml配置:
management:
  endpoints:
    web:
      exposure:
        include: "*"
访问http://localhost:7001/actuator/hystrix.stream 即可访问到断路器的执行状态,但是显示不太友好,因此需要dashboard。
新建项目,hystrix-dashboard
> Hystrix-dashboard(仪表盘)是一款针对Hystrix进行实时监控的工具,通过Hystrix Dashboard我们可以在直观地看到各Hystrix Command的请求响应时间, 请求成功率等数据。
pom.xml引入依赖包:
\<?xml version="1.0" encoding="UTF-8"?\>
<project xmlns="http://maven.apache.org/POM/_4.0.0" xmlns:xsi="http://www.w3.org/2001/XMLSchema-instance"
         xsi:schemaLocation="http://maven.apache.org/POM/4.0.0 https://maven.apache.org/xsd/maven-4.0.0.xsd"\>
    <modelVersion>4.0.0</modelVersion>
    <parent>
        <groupId>org.springframework.boot</groupId>
        <artifactId>spring-boot-starter-parent</artifactId>
        <version>2.3.6.RELEASE</version>
        <relativePath/> \<!-- lookup parent from repository --\>
    </parent>
    <groupId>com.luffy</groupId>
    <artifactId>hystrix-dashboard</artifactId>
    <version>0.0.1-SNAPSHOT</version>
    <name>hystrix-dashboard</name>
    <description>Demo project for Spring Boot</description>
    <properties>
        <java.version>1.8</java.version>
        <spring.cloud-version>Hoxton.SR9</spring.cloud-version>
    </properties>
    <dependencies>
        <dependency>
            <groupId>org.springframework.cloud</groupId>
            <artifactId>spring-cloud-starter-netflix-hystrix-dashboard</artifactId>
        </dependency>

        <dependency>
            <groupId>org.springframework.boot</groupId>
            <artifactId>spring-boot-starter</artifactId>
        </dependency>

        <dependency>
            <groupId>org.springframework.boot</groupId>
            <artifactId>spring-boot-starter-test</artifactId>
            <scope>test</scope>
        </dependency>
    </dependencies>
    <dependencyManagement>
        <dependencies>
            <dependency>
                <groupId>org.springframework.cloud</groupId>
                <artifactId>spring-cloud-dependencies</artifactId>
                <version>${spring.cloud-version}</version>
                <type>pom</type>
                <scope>import</scope>
            </dependency>
        </dependencies>
    </dependencyManagement>

    <build>
        <plugins>
            <plugin>
                <groupId>org.springframework.boot</groupId>
                <artifactId>spring-boot-maven-plugin</artifactId>
            </plugin>
        </plugins>
    </build>

</project>
启动类加上@EnableHystrixDashboard注解:
package com.luffy.hystrixdashboard;

import org.springframework.boot.SpringApplication;
import org.springframework.boot.autoconfigure.SpringBootApplication;
import org.springframework.cloud.netflix.hystrix.dashboard.EnableHystrixDashboard;

@SpringBootApplication
@EnableHystrixDashboard
public class HystrixDashboardApplication {

    public static void main(String[] args) {
        SpringApplication.run(HystrixDashboardApplication.class, args);
    }

}
application.yml
#应用名称
server:
  port: 9696

spring:
  application:
    name: hystrix-dashboard
hystrix:
  dashboard:
    proxy-stream-allow-list: "*"
访问localhost:9696/hystrix
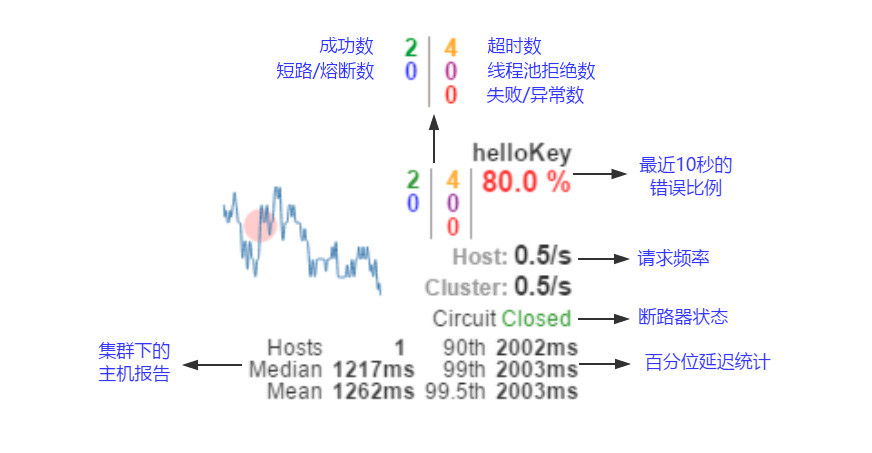
-
实心圆:它有颜色和大小之分,分别代表实例的监控程度和流量大小。如上图所示,它的健康度从绿色、黄色、橙色、红色递减。通过该实心圆的展示,我们就可以在大量的实例中快速的发现故障实例和高压力实例。
-
曲线:用来记录 2 分钟内流量的相对变化,我们可以通过它来观察到流量的上升和下降趋势。
-
其他一些数量指标如下图所示
>