通用指标示例程序部署
通用指标示例程序部署
为了演示效果,我们新建一个deployment来模拟业务应用。
$ cat custom-metrics-demo.yaml
apiVersion: apps/v1
kind: Deployment
metadata:
  name: custom-metrics-demo
spec:
  replicas: 1
  selector:
    matchLabels:
      app: custom-metrics-demo
  template:
    metadata:
      labels:
        app: custom-metrics-demo
    spec:
      containers:
      - name: custom-metrics-demo
        image: luxas/autoscale-demo:v0.1.2
        resources:
          limits:
            cpu: 50m
          requests:
            cpu: 50m
部署:
$ kubectl apply -f custom-metrics-demo.yaml

$ kubectl get po -o wide
custom-metrics-demo-95b5bc949-xpppl   1/1     Running   0          65s   10.244.1.194

$ curl 10.244.1.194:8080/metrics
# HELP http_requests_total The amount of requests served by the server in total
# TYPE http_requests_total counter
http_requests_total 2
注册为Prometheus的target:
$ cat custom-metrics-demo-svc.yaml
apiVersion: v1
kind: Service
metadata:
  name: custom-metrics-demo
  annotations:
    prometheus.io/scrape: "true"
    prometheus.io/port: "8080"
spec:
  ports:
  - port: 80
    targetPort: 8080
    name: http
  selector:
    app: custom-metrics-demo
  type: ClusterIP
自动注册为Prometheus的采集Targets。
通常web类的应用,会把每秒钟的请求数作为业务伸缩的指标依据。
实践:
使用案例应用custom-metrics-demo,如果custom-metrics-demo最近1分钟内每秒钟的请求数超过10次,则自动扩充业务应用的副本数。
-
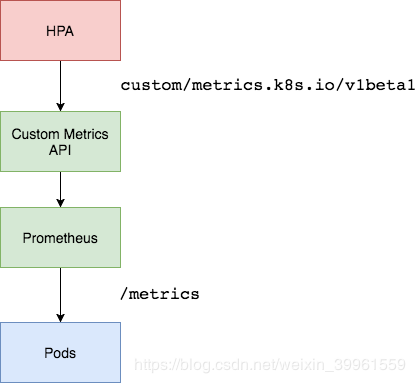
配置自定义指标
告诉Adapter去采集转换哪些指标,Adapter支持转换的指标,才可以作为HPA的依据
-
配置HPA规则
apiVersion: autoscaling/v2
kind: HorizontalPodAutoscaler
metadata:
  name: custom-app-hpa
  namespace: default
spec:
  scaleTargetRef:
    apiVersion: apps/v1
    kind: Deployment
    name: custom-metrics-demo
  minReplicas: 1
  maxReplicas: 3
  metrics:
  - type: Pods
    pods:
      metric:
        name: http_requests_per_second
      target:
        type: AverageValue
        averageValue: 10
Adapter配置自定义指标
思考:
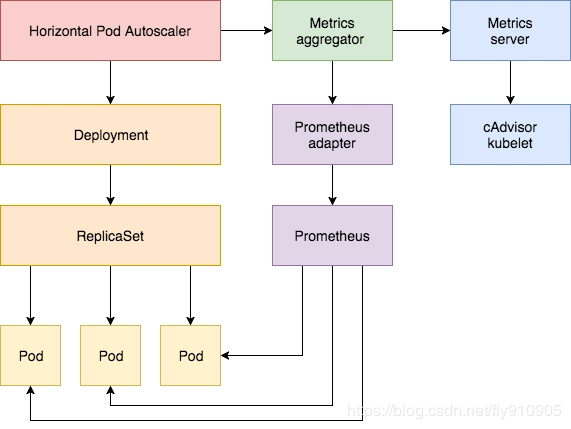
前面讲CPU的平均使用率的采集,其实是通过node_cpu_seconds_total指标计算得到的。
  ^
  │   . . . . . . . . . . . . . . . . .   . .   node_cpu{cpu="cpu0",mode="idle"}
  │     . . . . . . . . . . . . . . . . . . .   node_cpu{cpu="cpu0",mode="system"}
  │     . . . . . . . . . .   . . . . . . . .   node_load1{}
  │     . . . . . . . . . . . . . . . .   . .   node_cpu_seconds_total{...}
  v
    \<------------------ 时间 ----------------\>
同样,如果想获得每个业务应用最近1分钟内每�秒的访问次数,也是根据总数来做计算,因此,需要使用业务自定义指标http_requests_total,配合rate方法即可获取每秒钟的请求数。
rate(http_requests_total[2m])

# 如查询有多条数据,需做汇聚,需要使用sum
sum(rate(http_requests_total[2m])) by(kubernetes_pod_name)
-
自定义指标可以配置多个,因此,需要将规则使用数组来配置
rules:
- {} -
告诉Adapter,哪些自定义指标可以使用
rules:
- seriesQuery: 'http_requests_total{}'
seriesQuery是PromQL语句,和直接用
http_requests_total查询到的结果一样,凡是seriesQuery可以查询到的指标,都可以用作自定义指标 -
告诉Adapter,指标中的标签和k8s中的资源对象的关联关系
rules:
- seriesQuery: 'http_requests_total{}'
  resources:
    overrides:
      kubernetes_namespace: {resource: "namespace"}
      kubernetes_pod_name: {resource: "pod"}
hpa 拿着k8s里的namepace和pod名称,来查询adaptor,adaptor去查询Prometheus的时候根据resources的适配来转换,namepace=default, pod=front-app-xxxx, kubernetes_namespace="default"
我们查询到的可用指标格式为:
http_requests_total{instance="10.244.2.140:8080", job="kubernetes-sd-endpoints", kubernetes_name="custom-metrics-demo", kubernetes_namespace="default", kubernetes_pod_name="front-app-df5fc79dd-rmzr6", namespace="default", pod="front-app-df5fc79dd-rmzr6"}由于HPA在调用Adapter接口的时候,告诉Adapter的是查询哪个命名空间下的哪个Pod的指标,因此,Adapter在去查询的时候,需要做一层适配转换(因为并不是每个prometheus查询到的结果中都是叫做
kubernetes_namespace和kubernetes_pod_name)/apis/custom.metrics.k8s.io/v1beta2/namespaces/default/pods/xxx/http_requests_total -
指定自定义的指标名称,供HPA配置使用
rules:
- seriesQuery: 'http_requests_total{}'
  resources:
    overrides:
      kubernetes_namespace: {resource: "namespace"}
      kubernetes_pod_name: {resource: "pod"}
  name:
    as: "http_requests_per_second"
因为Adapter转换完之后的指标含义为:每秒钟的请求数。因此提供指标名称,该配置根据正则表达式做了匹配替换,转换完后的指标名称为:http_requests_per_second,HPA规则中可以直接配置该名称。
-
告诉Adapter如何获取最终的自定义指标值
    rules:
    - seriesQuery: 'http_requests_total{}'
      resources:
        overrides:
          kubernetes_namespace: {resource: "namespace"}
          kubernetes_pod_name: {resource: "pod"}
      name:
        as: "http_requests_per_second"
      metricsQuery: 'sum(rate(\<\<.Series>\>{\<\<.LabelMatchers>\>}[2m])) by (\<\<.GroupBy>\>)'
我们最终期望的写法可能是这样:
sum(rate(http_requests_total{kubernetes_namespace="default",kubernetes_pod_name="xxxx"}[2m])) by (kubernetes_pod_name)
但是Adapter提供了更简单的写法:
sum(rate(\<\<.Series>\>{\<\<.LabelMatchers>\>}[2m])) by (\<\<.GroupBy>\>)
Series: 指标名称LabelMatchers: 指标查询的labelGroupBy: 结果分组,针对HPA过来的查询,都会匹配成kubernetes_pod_name
更新Adapter的配置:
$ vi custom-metrics-configmap.yaml
apiVersion: v1
kind: ConfigMap
metadata:
  name: adapter-config
  namespace: monitor
data:
  config.yaml: |
    rules:
    - seriesQuery: 'http_requests_total'
      seriesFilters: []
      resources:
        overrides:
          kubernetes_namespace: {resource: "namespace"}
          kubernetes_pod_name: {resource: "pod"}
      name:
        as: "http_requests_per_second"
      metricsQuery: (sum(rate(\<\<.Series>\>{\<\<.LabelMatchers>\>}[2m])) by (\<\\<.GroupBy>\\>))
需要更新configmap并重启adapter服务:
$ kubectl apply -f custom-metrics-configmap.yaml

$ kubectl -n monitor delete po custom-metrics-apiserver-c689ff947-zp8gq
实际中,hpa会去对如下地址发起请求,获取数据:
$ kubectl get --raw /apis/custom.metrics.k8s.io/v1beta2/namespaces/default/pods/custom-metrics-demo-776f497584-5slf9/http_requests_per_second |jq
{
  "kind": "MetricValueList",
  "apiVersion": "custom.metrics.k8s.io/v1beta2",
  "metadata": {
    "selfLink": "/apis/custom.metrics.k8s.io/v1beta2/namespaces/default/pods/custom-metrics-demo-776f497584-5slf9/http_requests_per_second"
  },
  "items": [
    {
      "describedObject": {
        "kind": "Pod",
        "namespace": "default",
        "name": "custom-metrics-demo-776f497584-5slf9",
        "apiVersion": "/v1"
      },
      "metric": {
        "name": "http_requests_per_second",
        "selector": null
      },
      "timestamp": "2022-12-03T10:59:56Z",
      "value": "33m"
    }
  ]
}
其中33m等于0.033,即当前指标查询每秒钟请求数为0.033次.
我们发现有两个可用的resources,引用官方的一段解释:
Notice that we get an entry for both "pods" and "namespaces" -- the adapter exposes the metric on each resource that we've associated the metric with (and all namespaced resources must be associated with a namespace), and will fill in the \<\<.GroupBy>\> section with the appropriate label depending on which we ask for.

We can now connect to $KUBERNETES/apis/custom.metrics.k8s.io/v1beta1/namespaces/default/pods/*/nginx_vts_server_requests_per_second, and we should see
https://github.com/DirectXMan12/k8s-prometheus-adapter/blob/master/docs/config-walkthrough.md
https://github.com/DirectXMan12/k8s-prometheus-adapter/blob/master/docs/config.md