跳到主要内容

14 篇博文 含有标签「Prometheus」

查看所有标签

Alertmanager 告警配置

· 阅读需 5 分钟

部署在二进制安装篇有写

邮件通知

配置并启动 alertmanager

global:
resolve_timeout: 5m
smtp_from: 'xxxx@qq.com'
smtp_smarthost: 'smtp.qq.com:465'
smtp_auth_username: 'xxxx@qq.com'
smtp_auth_password: 'uukxxxxdvnxzbiaf'
smtp_require_tls: false
smtp_hello: '@qq.com'
route:
group_by: ['alertname']
group_wait: 10s
group_interval: 2m
repeat_interval: 5m
receiver: 'web.hook'
# #receiver: 'default-receiver' #其他的告警发送给default-receiver
# routes: #将critical的报警发送给myalertname
# - reciver: myalertname
# group_wait: 10s
receivers:
- name: 'web.hook'
# webhook_configs:
# - url: 'http://127.0.0.1:5001/'
email_configs:
- to: 'xxxx@qq.com'
inhibit_rules:
- source_match: #源匹配级别,当匹配成功发出通知,但是其他'alertname','dev','instance'产生的warning级别的告警通知将被抑制
severity: 'critical' #报警的事件级别
target_match:
severity: 'warning' #匹配目标为新产生的目标告警为'warning' 将被抑制
equal: ['alertname', 'dev', 'instance']

配置 prometheus 报警规则

# 创建角色目录
mkdir /apps/prometheus/rules && cd /apps/prometheus/rules

# 编写配置文件
vim server_rules.yaml
#---------------------------------

groups:
- name: alertmanager_pod.rules
rules:
- alert: Pod_all_cpu_usage
expr: (sum by(name)(rate(container_cpu_usage_seconds_total{image!=""}[5m]))*100) > 10
for: 2m
labels:
severity: critical
service: pods
annotations:
description: 容器 {{ $labels.name }} CPU 资源利用率大于 10% , (current value is {{ $value }})
summary: Dev CPU 负载告警

- alert: Pod_all_memory_usage
#expr: sort_desc(avg by(name)(irate(container_memory_usage_bytes{name!=""}[5m]))*100) > 10 #内存大于10%
expr: sort_desc(avg by(name)(irate(node_memory_MemFree_bytes {name!=""}[5m]))) > 2147483648 #内存大于2G
for: 2m
labels:
severity: critical
annotations:
description: 容器 {{ $labels.name }} Memory 资源利用率大于 2G , (current value is {{ $value }})
summary: Dev Memory 负载告警

- alert: Pod_all_network_receive_usage
expr: sum by (name)(irate(container_network_receive_bytes_total{container_name="POD"}[1m])) > 50*1024*1024
for: 2m
labels:
severity: critical
annotations:
description: 容器 {{ $labels.name }} network_receive 资源利用率大于 50M , (current value is {{ $value }})

- alert: node内存可用大小
expr: node_memory_MemFree_bytes > 512*1024*1024 #故意写错的
#expr: node_memory_MemFree_bytes > 1 #故意写错的(容器可用内存小于100k)
for: 15s
labels:
severity: critical
annotations:
description: node可用内存小于4G

- name: alertmanager_node.rules
rules:
- alert: 磁盘容量
expr: 100-(node_filesystem_free_bytes{fstype=~"ext4|xfs"}/node_filesystem_size_bytes {fstype=~"ext4|xfs"}*100) > 80 #磁盘容量利用率大于80%
for: 2s
labels:
severity: critical
annotations:
summary: "{{$labels.mountpoint}} 磁盘分区使用率过高!"
description: "{{$labels.mountpoint }} 磁盘分区使用大于80%(目前使用:{{$value}}%)"

- alert: 磁盘容量
expr: 100-(node_filesystem_free_bytes{fstype=~"ext4|xfs"}/node_filesystem_size_bytes {fstype=~"ext4|xfs"}*100) > 60 #磁盘容量利用率大于60%
for: 2s
labels:
severity: warning
annotations:
summary: "{{$labels.mountpoint}} 磁盘分区使用率过高!"
description: "{{$labels.mountpoint }} 磁盘分区使用大于80%(目前使用:{{$value}}%)"

Prometheus 加载报警规则

vim /apps/prometheus/prometheus.yml

alerting:
alertmanagers:
- static_configs:
- targets:
- 192.168.15.100:9093

# 文件路径:
rule_files:
- /apps/prometheus/rules/server_rules.yaml

规则验证

./promtool check rules rules/server_rules.yaml
Checking rules/server_rules.yaml
SUCCESS: 4 rules found

重启 prometheus

systemctl restart prometheus.service

使用 amtool查看当前告警

./amtool alert --alertmanager.url=http://192.168.15.100:9093
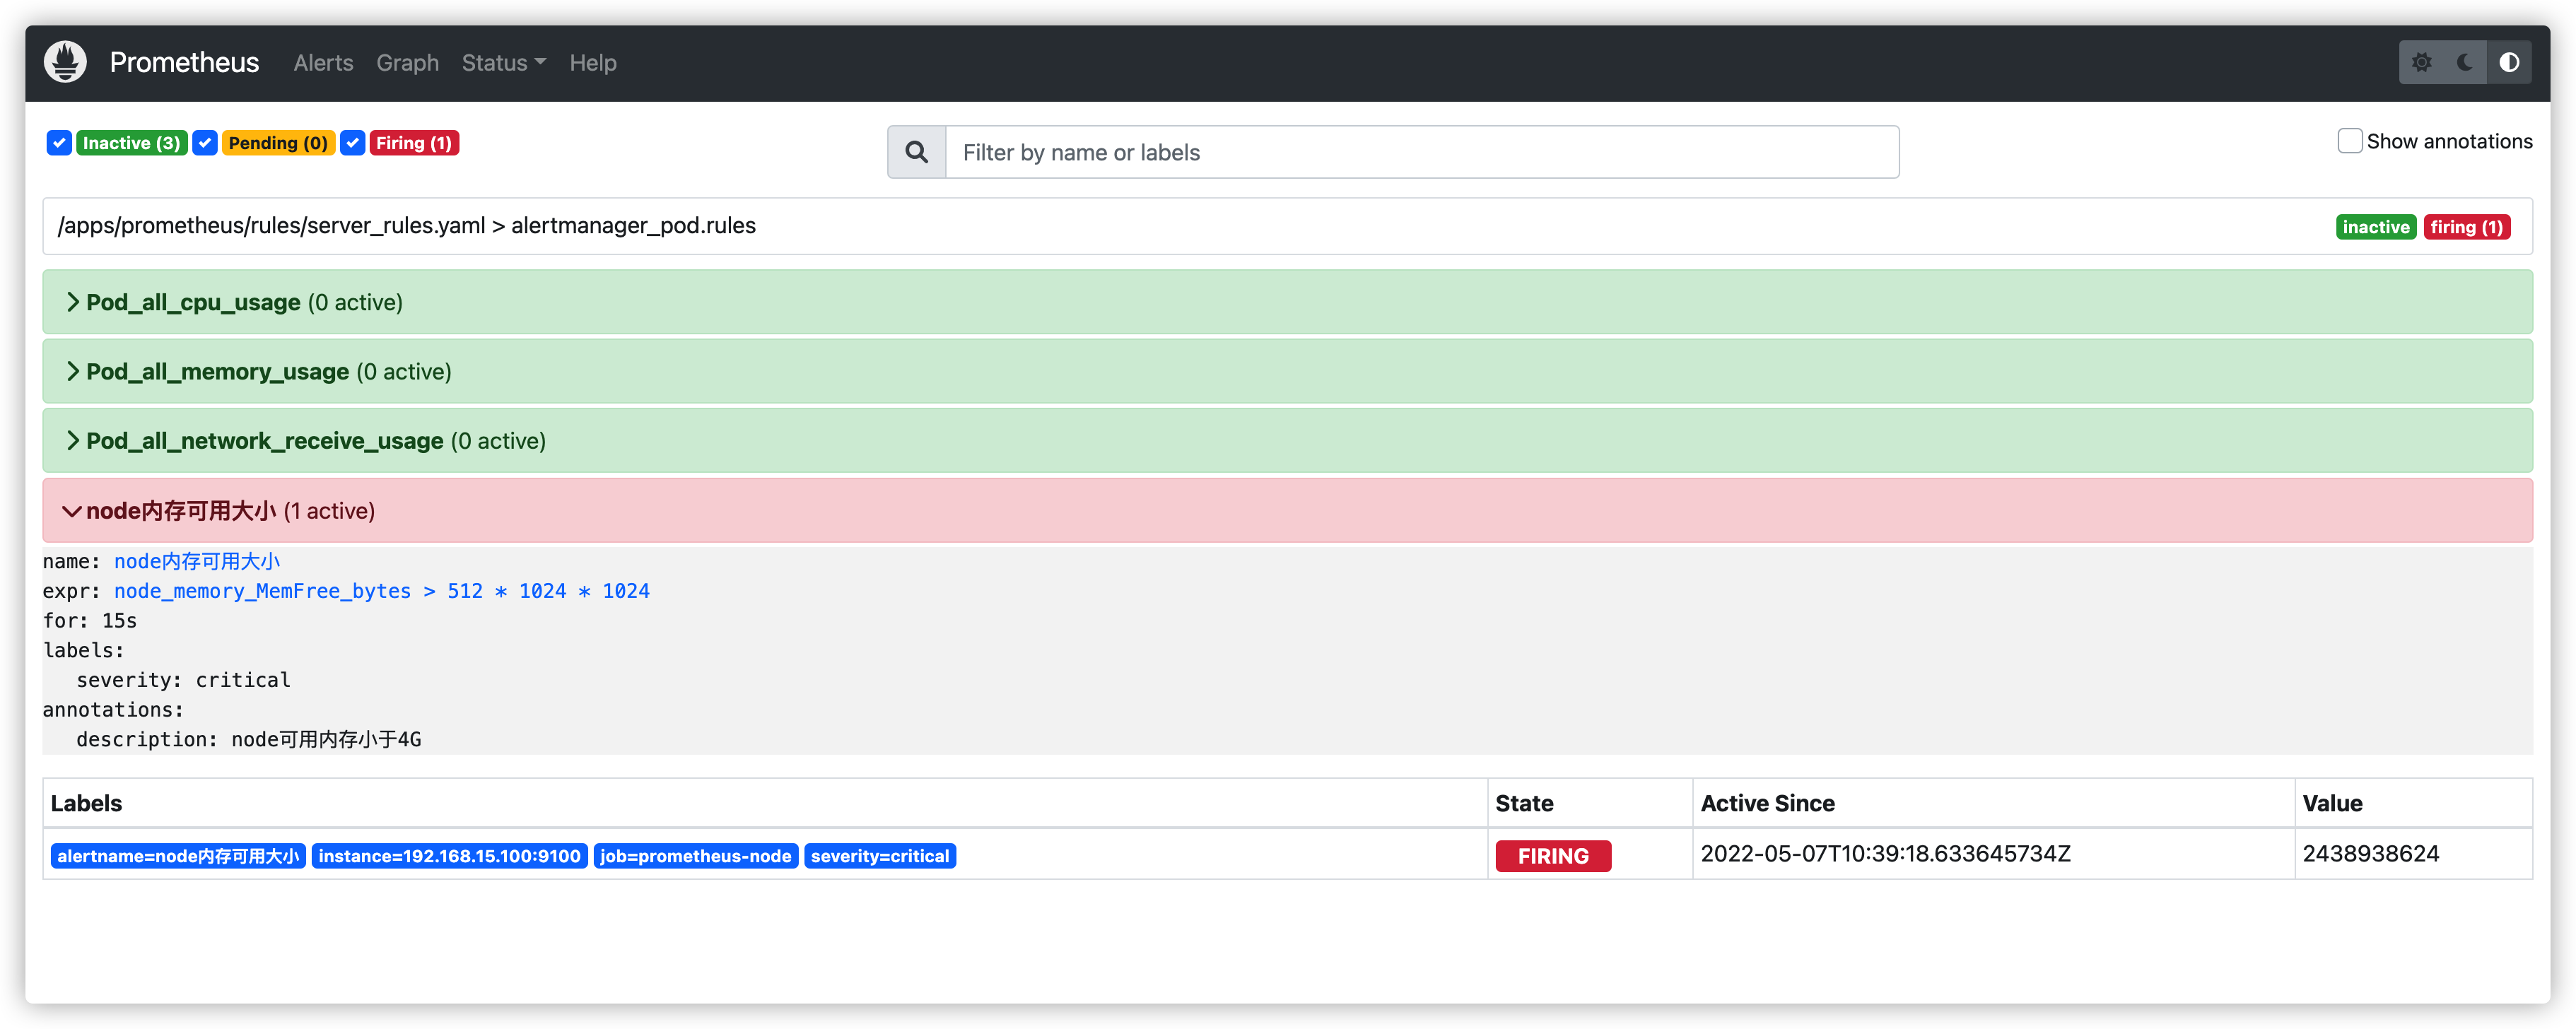
![prome验证](/img/AlertManager 告警配置/prome.png)

prometheus 报警状态

inactive:没有异常

pending:已经出发阈值,但未满足告警持续时间(即rule中的for字段)

firing:已经触发阈值并满足条件发送至alertmanager
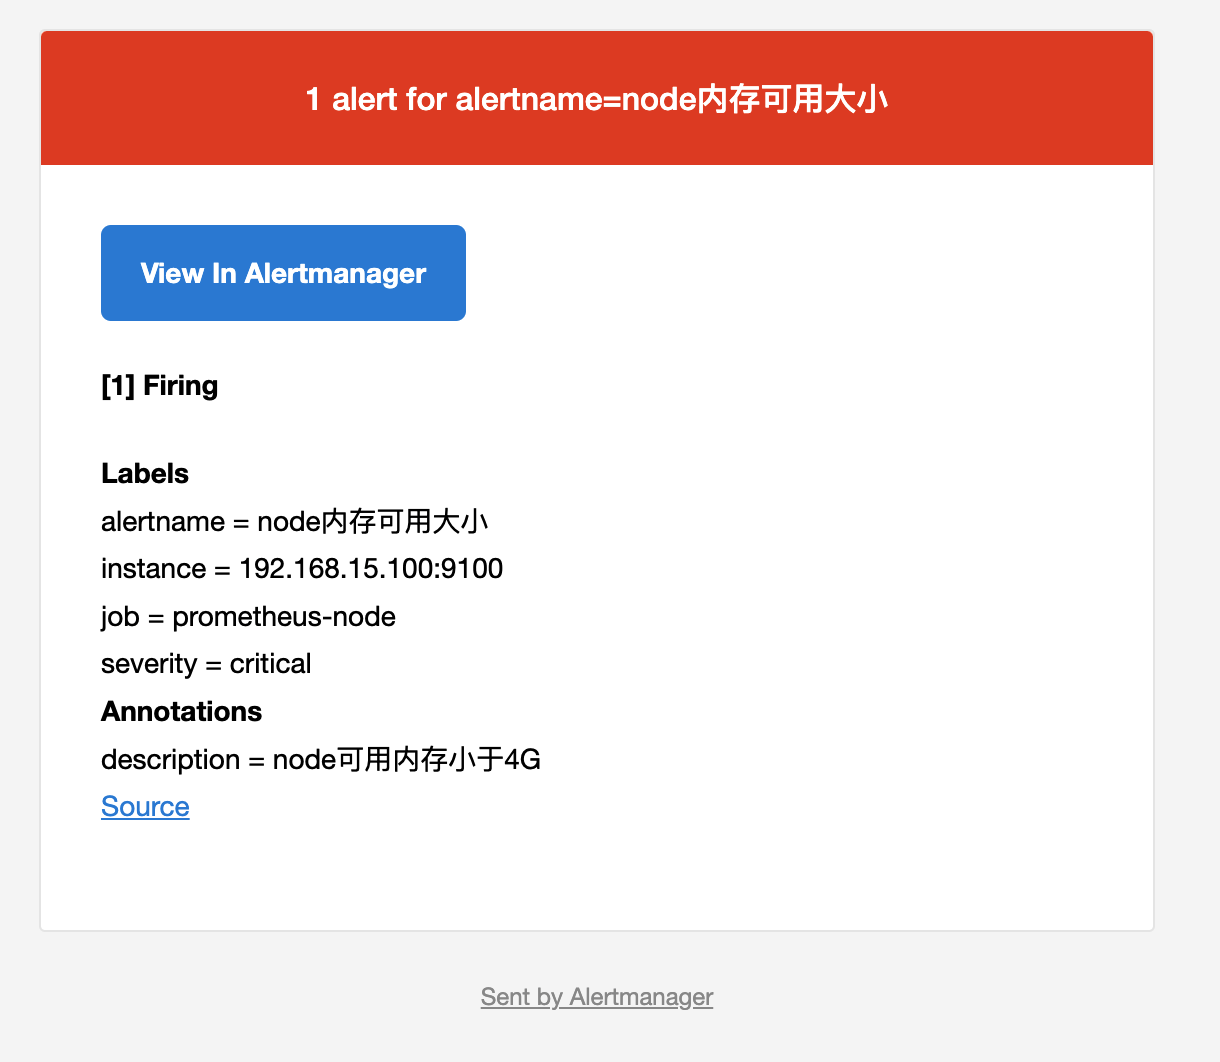
邮箱验证邮件:

![邮箱验证](/img/AlertManager 告警配置/email.png)

钉钉告警通知

钉钉群创建机器人 - 关键字认证

Webhook 复制

* 安全设置 (☑️勾选自定义关键字)
alertname

钉钉认证 - 关键字

# 创建脚本目录
mkdir /data/scripts -p

vim /data/scripts/dingding-keywords.sh
#!/bin/bash
source /etc/profile
#PHONE=$1
#SUBJECT=$2
MESSAGE=$1

/usr/bin/curl -X "POST" "https://oapi.dingtalk.com/robot/send?access_token=ba76276cd923xxe5dcd653fxxxx4b71c4a23e8c4eb8e91446840d527c8d9cd4e' \
-H 'Content-Type: application/json' \
-d '{"msgtype": "text",
"text": {
"content": "'${MESSAGE}'"
}
}'

测试发送消息

/usr/bin/curl -v -XPOST  \
-H 'Content-Type: application/json' \
-d '{"msgtype": "text","text": {"content": "namespace=default\npod=pod1\ncpu=87%\n 持续时间=4.5m\nalertname=pod"}}' 'https://oapi.dingtalk.com/robot/send?access_token=766379d2ee757779c06ea6ff531d2d52640571293c3e1eedd42d71c19e60af07'

-------------------
# 或者按上面的脚本去 bash /data/scripts/dingding-keywords.sh 后接参数

钉钉接收到告警信息

部署 webhook-dingtalk

# 下载解压
cd /apps
wget https://github.com/timonwong/prometheus-webhook-dingtalk/releases/download/v1.4.0/prometheus-webhook-dingtalk-1.4.0.linux-amd64.tar.gz
tar xf prometheus-webhook-dingtalk-1.4.0.linux-amd64.tar.gz

# 运行
cd prometheus-webhook-dingtalk-1.4.0.linux-amd64

nohup ./prometheus-webhook-dingtalk --web.listen-address="192.168.15.100:8060" --ding.profile="alertname=https://oapi.dingtalk.com/robot/send?access_token=766379d2ee757779c06ea6ff531d2d52640571293c3e1eedd42d71c19e60af07" &

alertmanager 修改配置

vi /apps/alertmanager/alertmanager.yml

global:
resolve_timeout: 5m
smtp_from: 'xxxx@qq.com'
smtp_smarthost: 'smtp.qq.com:465'
smtp_auth_username: 'xxxx@qq.com'
smtp_auth_password: 'gtiuxxxxngxybhdi'
smtp_require_tls: false
smtp_hello: '@qq.com'
route:
group_by: ['alertname']
group_wait: 10s
group_interval: 1m
repeat_interval: 5m
receiver: 'dingding'
#receiver: 'web.hook'
# #receiver: 'default-receiver' #其他的告警发送给default-receiver
# routes: #将critical的报警发送给myalertname
# - reciver: myalertname
# group_wait: 10s
receivers:
- name: dingding
webhook_configs:
- url: 'http://192.168.15.100:8060/dingding/alertname/send'
send_resolved: true
- name: 'web.hook'
# webhook_configs:
# - url: 'http://127.0.0.1:5001/'
email_configs:
- to: 'xxxx@qq.com'
send_resolved: true
inhibit_rules:
- source_match: #源匹配级别,当匹配成功发出通知,但是其他'alertname','dev','instance'产生的warning级别的告警通知将被抑制
severity: 'critical' #报警的事件级别
target_match:
severity: 'warning' #匹配目标为新产生的目标告警为'warning' 将被抑制
equal: ['alertname', 'dev', 'instance']

Prometheus 联邦集群

· 阅读需 2 分钟

Prometheus 联邦集群

Prometheus Server 环境:

192.168.15.100 #主节点

192.168.15.101 #联邦节点1

192.168.15.102 #联邦节点2

192.168.15.101 #node1,联邦节点1的目标采集服务器

192.168.15.101 #node2,联邦节点1的目标采集服务器

部署 prometheus server

Prometheus 主Server 和 prometheus 联邦 server 分别部署 prometheus

cd /apps
tar xvf prometheus-2.32.1.liunx-amd64.tar.gz

# 创建软连接
ln -sv /apps/prometheus-2.32.1.liunx-amd64 /apps/prometheus

cd /apps/prometheus
# 检测配置文件、检测 metrics 数据等
./promtool check config prometheus.yml

vim /etc/systemd/system/prometheus.service

[Unit]
Description=Prometheus Server
Documentation=https://prometheus.io/docs/introduction/overview/
After=network.target

[Service]
Restart=on-failure
WorkingDirectory=/apps/prometheus/
ExecStart=/apps/prometheus/prometheus --config.file=/apps/prometheus/prometheus.yml

[Install]
WantedBy=multi-user.target

启动 prometheus 服务

systemctl daemon-reload
systemctl restart prometheus
systemctl enable prometheus

node_exporter 部署

下载解压二进制程序

cd /apps 
wget https://github.com/prometheus/node_exporter/releases/download/v1.3.1/node_exporter-1.3.1.linux-amd64.tar.gz
tar xf node_exporter-1.3.1.linux-amd64.tar.gz

# 创建软连接
ln -sv /apps/node_exporter-1.3.1.linux-amd64 /apps/node_exporter

创建 node-exporter service 启动脚本

vim /etc/systemd/system/node-exporter.service

[Unit]
Description=Prometheus Node Exporter
After=network.target

[Service]
ExecStart=/apps/node_exporter/node_exporter

[Install]
wantedBy=multi-user.target

启动 node exporter 服务

systemctl daemon-reload
systemctl restart node-exporter
systemctl enable node-exporter.service

配置联邦 server 监控 node_exporter

分别在联邦节点1 监控 node1,在联邦节点2 监控 node2

Prometheus 联邦节点1
vim /apps/prometheus/prometheus.yml

- job_name: 'prometheus-node'
static_configs:
- targets: ['192.168.15.101:9100'] #node_exporter1

# 重启 Prometheus 服务
systemctl restart prometheus.service
Prometheus 联邦节点2
vim /apps/prometheus/prometheus.yml

- job_name: 'prometheus-node'
static_configs:
- targets: ['192.168.15.102:9100'] #node_exporter2

# 重启 Prometheus 服务
systemctl restart prometheus.service

分别查看 prometheus target 中是否存在数据

prometheus server 采集联邦 server

  - job_name: 'prometheus'
# metrics_path defaults to '/metrics'
# scheme defaults to 'http'
static_configs:
- targets: ['localhost:9090']

- job_name: 'prometheus-federate-2.101'
scrape_interval: 10s
honor_labels: true
metrics_path: '/federate'
params:
'match[]':
- '{job="prometheus"}'
- '{__name__=~"job:.*"}'
- '{__name__=~"node.*"}'
static_configs:
- targets:
- '192.168.15.101:9090'

- job_name: 'prometheus-federate-2.102'
scrape_interval: 10s
honor_labels: true
metrics_path: '/federate'
params:
'match[]':
- '{job="prometheus"}'
- '{__name__=~"job:.*"}'
- '{__name__=~"node.*"}'
static_configs:
- targets:
- '192.168.15.102:9090'

验证 prometheus server

查看 192.168.15.100:9090/targets 是否存在联邦 prometheus 数据

验证指标数据

在 graph 界面查询 node_load1 查看是否存在数据

Pushgateway 采集数据

· 阅读需 4 分钟

Pushgateway 基本概念

Pushgateway 是采用被动推送的方式,而不是类似于prometheus server 主动连接 exporter获取监控数据

pushgateway 可以单独运行在一个节点,然后需要自定义监控脚本把需要监控的主动推送给pushgateway的API接口,然后 pushgateway 等待 prometheus server 抓取数据,即 pushgateway 本身没有任何抓取监控数据的功能,目前 pushgateway 只是被动的等待数据从客户端推送过来

--persistence.file="" #数据保存的文件,默认只保存在内存中

--persistence.interval=5m #数据持久化的间隔时间

部署 pushgateway

# docker 部署
docker run -d --name pushgateway -p 9091:9091 prom/pushgateway

# 二进制安装
cd /apps
wget https://github.com/prometheus/pushgateway/releases/download/v1.4.2/pushgateway-1.4.2.linux-amd64.tar.gz
tar zxf pushgateway-1.4.2.linux-amd64.tar.gz

# 编写 centos7 控制脚本

cat > /etc/systemd/system/pushgateway.service << EOF
[Unit]
Description=pushgateway
After=network.target

[Service]
Restart=on-failure
WorkingDirectory=/apps/pushgateway
ExecStart=/apps/pushgateway/pushgateway # 如果需要持久化pushgateway数据,可以加上--persistence.file="" 和--persistence.interval=5m 两个参数

[Install]
WantedBy=multi-user.target
EOF

prometheus 到 pushgateway 采集数据

验证 pushgateway

curl 192.168.15.100:9091/metrics

prometheus 配置数据采集

vim prometheus-cfg.yaml

  - job_name: 'pushgateway-monitor'
scrape_interval: 5s
static_configs:
- targets: ['192.168.15.100:9091']
honor_labels: true
  • honor_labels 控制 Prometheus 如何处理已经存在于已抓取数据中的标签与 Prometheus 将附加服务器端的标签之间的冲突("job"和"instance"标签,手动配置的目标标签以及服务发现实现生成的标签)
  • 如果 honor_labels 设置为 "true",则通过保留已抓取数据的标签值并忽略冲突的服务器端标签来解决标签冲突
  • 如果 honor_labels 设置为 "false",则通过将已抓取数据中的冲突标签重命名为 "exported_<original-label>" (例如 "exported_instance", "exported_job") 然后附加服务器端标签来解决标签冲突
kubectl apply -f prometheus-cfg.yaml
kubectl delete -f prometheus-deploy.yaml
kubectl applt -f prometheus-deploy.yaml

## 验证一下数据
查看 prometheus 在 target 中是否存在 pushgateway

测试从客户端推送单条数据

Push 数据到 Pushgateway 中,可以通过其提供的 API 标准接口来添加,默认的 URL 地址为:

http://<ip>:9091/metrics/job/<JOBNAME>/<LABEL_NAME>/<LABEL_VALUE>

其中 <JOBNAME> 是必填项,为 job 标签值,后边可以跟任何数量的标签对,一般我们会添加一个 instance/<INSTANCE_NAME> 实例名称标签,来方便区分各个指标

推送一个 job 名称为 mytest_job ,key 为 mytest_metric 值为 2022

echo "mytest_metric 2022" | curl --data-binary @- http://192.168.3.100:9091/metrics/job/mytest_job

echo "mytest_metric 2333" | curl --data-binary @- http://192.168.3.100:9091/metrics/job/mytest_job
pushgateway 验证数据
# 192.168.15.100/#  在 web 界面查看 

除了 mytest_metric 外,同时还新增了 push_time_seconds 和 push_failure_time_seconds 两个标签,这两个是 Pushgateway 自动生成的指标,分别用于记录指标数据的成功上传时间和失败上传时间

# 查看 192.168.15.100:9091/metrics
搜索关键字:mytest ,会发现有此指标
prometheus server 验证数据

在 Graph 页面查询 mytest_metric 可以看到图标即是有数据的

测试从客户端推送多条数据

推送多条数据
cat <<EOF | curl --date-binary @- http://192.168.15.100:9091/metrics/job/test_job/instance/192.168.15.101
#TYPE node_memory_usage gauge
node_memory_usage 4311744512
# TYPE memory_total gauge
node_memory_total 103481868288
EOF
pushgateway 验证数据
# 192.168.15.100/#  在 web 界面查看 
prometheus server

在 Graph 页面查询 node_memory_total 可以看到图标即是有数据的

自定义收集数据

基于自定义脚本实现数据的收集和推送

自定义脚本 vim mem_monitor.sh

#!/bin/bash

total_memory=$(free|awk '/Mem/{print $2}')
used_memory=$(free |awk '/Mem/{print $3}')

job_name="custom_memory_monitor"
instance_name=`ifconfig eth0 | grep -w inet | awk '{print $2}'`
pushgateway_server="htpp://192.168.15.100:9091/metrics/job"

cat <<EOF | curl --date-binary @- ${pushgateway_server}/${job_name}/instance/${instance_name}
#TYPE custom_memory_total gauge
custom_memory_total $total_memory
#TYPE custom_memory_used gauge
custom_memory_used $used_memory
EOF

分别在不同主机执行脚本,验证指标数据收集和推送

bash mem_monitor.sh
Pushgateway 验证数据
192.168.15.100:9091/#  查看数据
prometheus 验证数据

在 Graph 页面查询 custom_memory_total 可以看到图标即是有数据的

删除数据

先对一个组写入多个 instance 的数据

cat <<EOF | curl --date-binary @- http://192.168.15.100:9091/metrics/job/test_job/instance/192.168.15.101
#TYPE node_memory_usage gauge
node_memory_usage 4311744512
# TYPE memory_total gauge
node_memory_total 103481868288
EOF

cat <<EOF | curl --date-binary @- http://192.168.15.100:9091/metrics/job/test_job/instance/192.168.15.102
#TYPE node_memory_usage gauge
node_memory_usage 4311744512
# TYPE memory_total gauge
node_memory_total 103481868288
EOF
通过 API 删除指定组内指定实例的数据
curl -X DELETE http://192.168.15.100:9091/metrics/job/test_job/instance/192.168.15.101

# web浏览 192.168.15.100:9091/#
通过 web 界面删除

直接在数据右边点 Delete Group